
How do we collect statistics and how to use analytics page
Every landing page needs conversions and every conversion needs tracking. We provide user tracking on your pages out of the box so you can analyze visits, clicks, and leads. Save your time and understand your users better without integrating any external tools.
How do we track?
We track user data from every visit and store it in aggregated state anonymizing sensitive or private information. Your users get privacy and you get information about the visits:
- Visited page to compare which page is most visited.
- HTTP referrer (that identifies the address of the webpage which is linked to the resource being requested) to understand what is your main traffic source.
- Country to understand your users geography.
- Device type to know how many laptops or mobile devices visits your pages.
How to use analytics page?
You need a PRO account to get access to the analytics page. This page contains filtering so you can watch overall statistics or statistics from the specific page.
The main part of the analytics page is dedicated to users visits. Continue reading to see how we present the visits data.
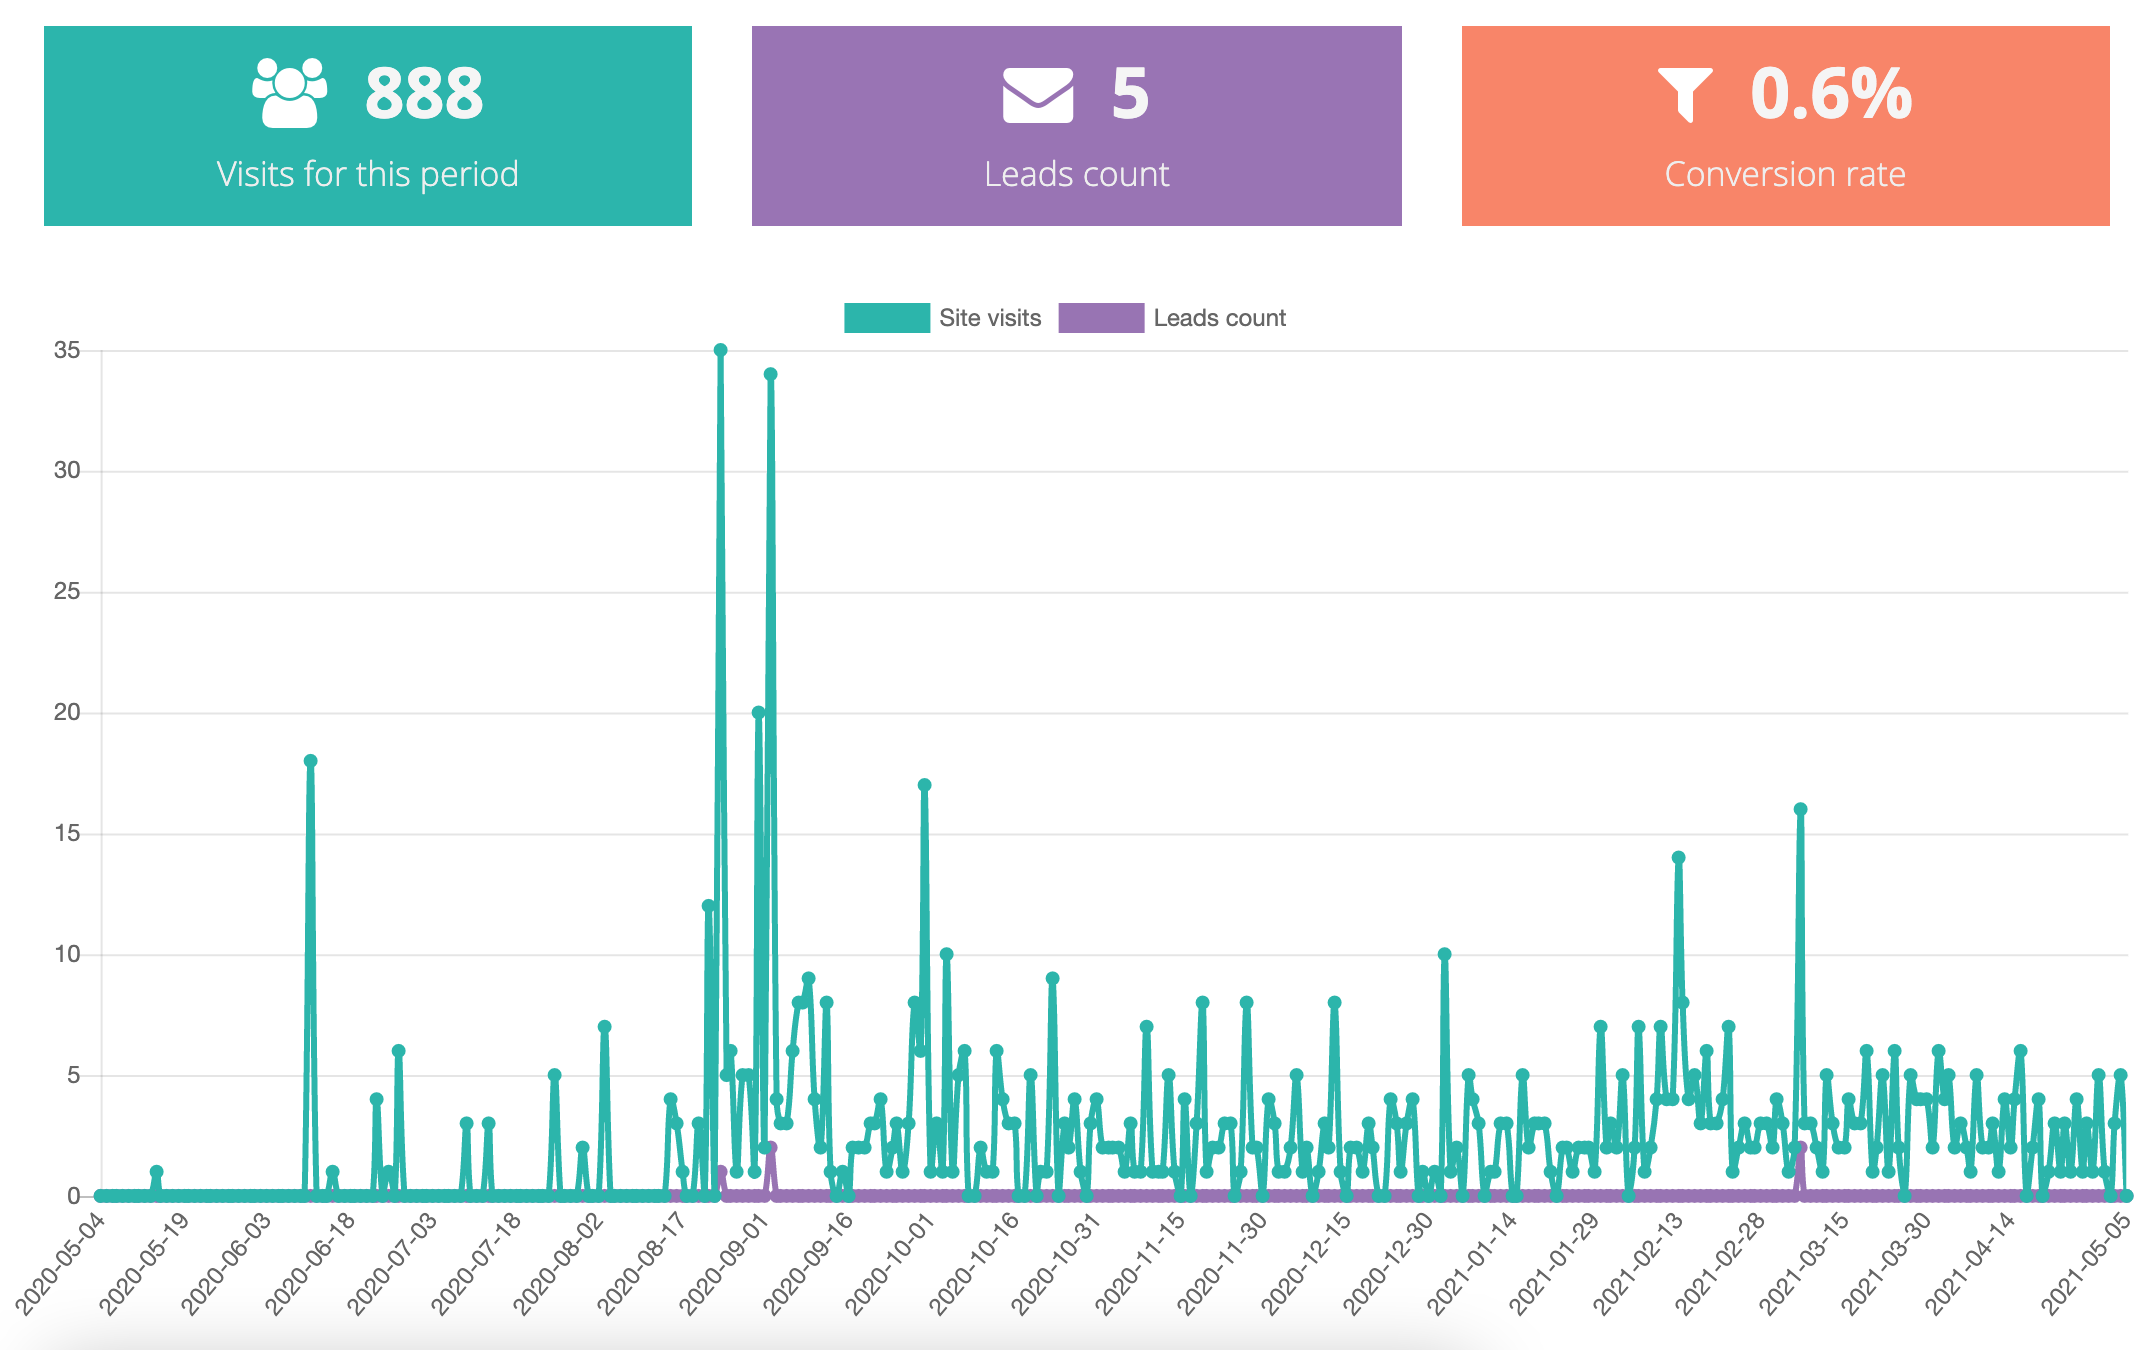
Main block
The main block will show you the basic information — how many visitors and leads do you have on your pages and how good is the conversion rate between them.
Conversion rate is defined as the number of visitors to a website that complete a desired goal (a conversion) out of the total number of visitors. Conversion rates are an effective way of comparing and contrasting the performance of multiple traffic channels like advertising or referring traffic.
Visits explained block
Below the main block you can see visits explained block — where you can see more detailed information about your users. In this section you can see information about referrer which is defined as the origin of the visitor to a website. Also, there is a device type statistics on the number of visits based on the type of device – desktop, tablet, or mobile.
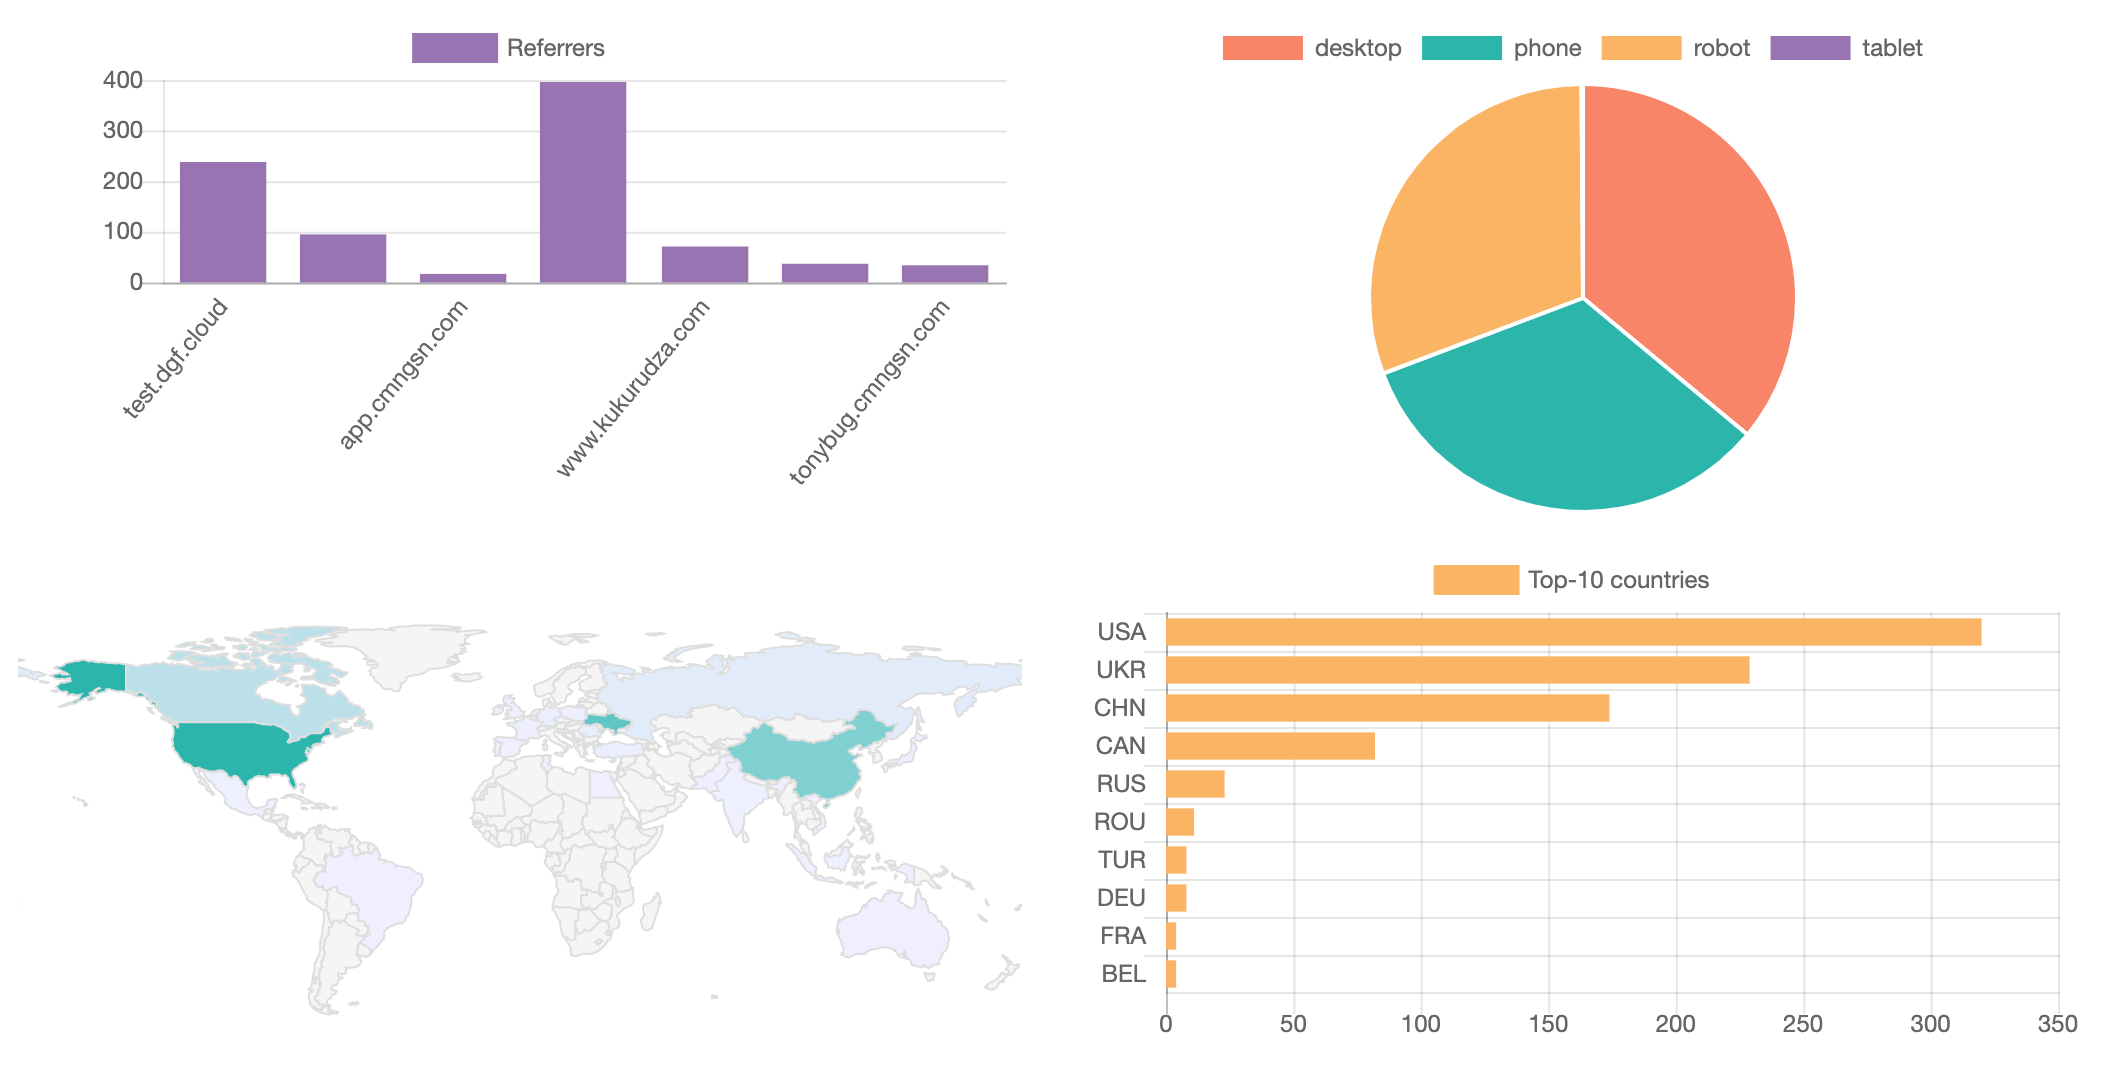
At the end of the block you will see countries charts so you can see your pages visiting on the map.
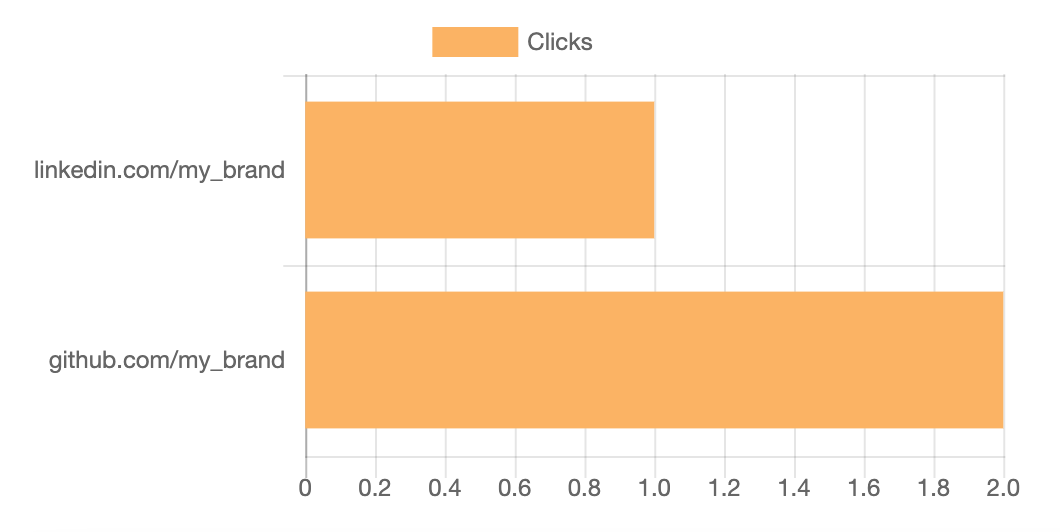
Link clicks block
The last block is the clicks counting chart that will give you an information of how your visitors click to your social links. This chart is helpful when you have links to social accounts and you are trying to understand which social network performs better.
TL;DR
Combination of tracking and analytics page for your CMNGSN pages is a great tool that gives you more information about visits, clicks, and leads out of the box.
Give it a try and understand your clients better!